To analyze MEA recordings, users can load data files (.mcd or .h5), which include data derived from all (up to 60) electrodes. The users can select the desired electrodes and specific data segments for further analysis. After saving the selected data, noise and electric frequency interference filtrations are applied. For peak detection and biomarker calculation, users can adjust the default settings to ensure accurate analysis. The calculated biomarkers are then plotted as a function of time and presented as a histogram and bar graph. The data are saved for additional analysis as data files and figures.
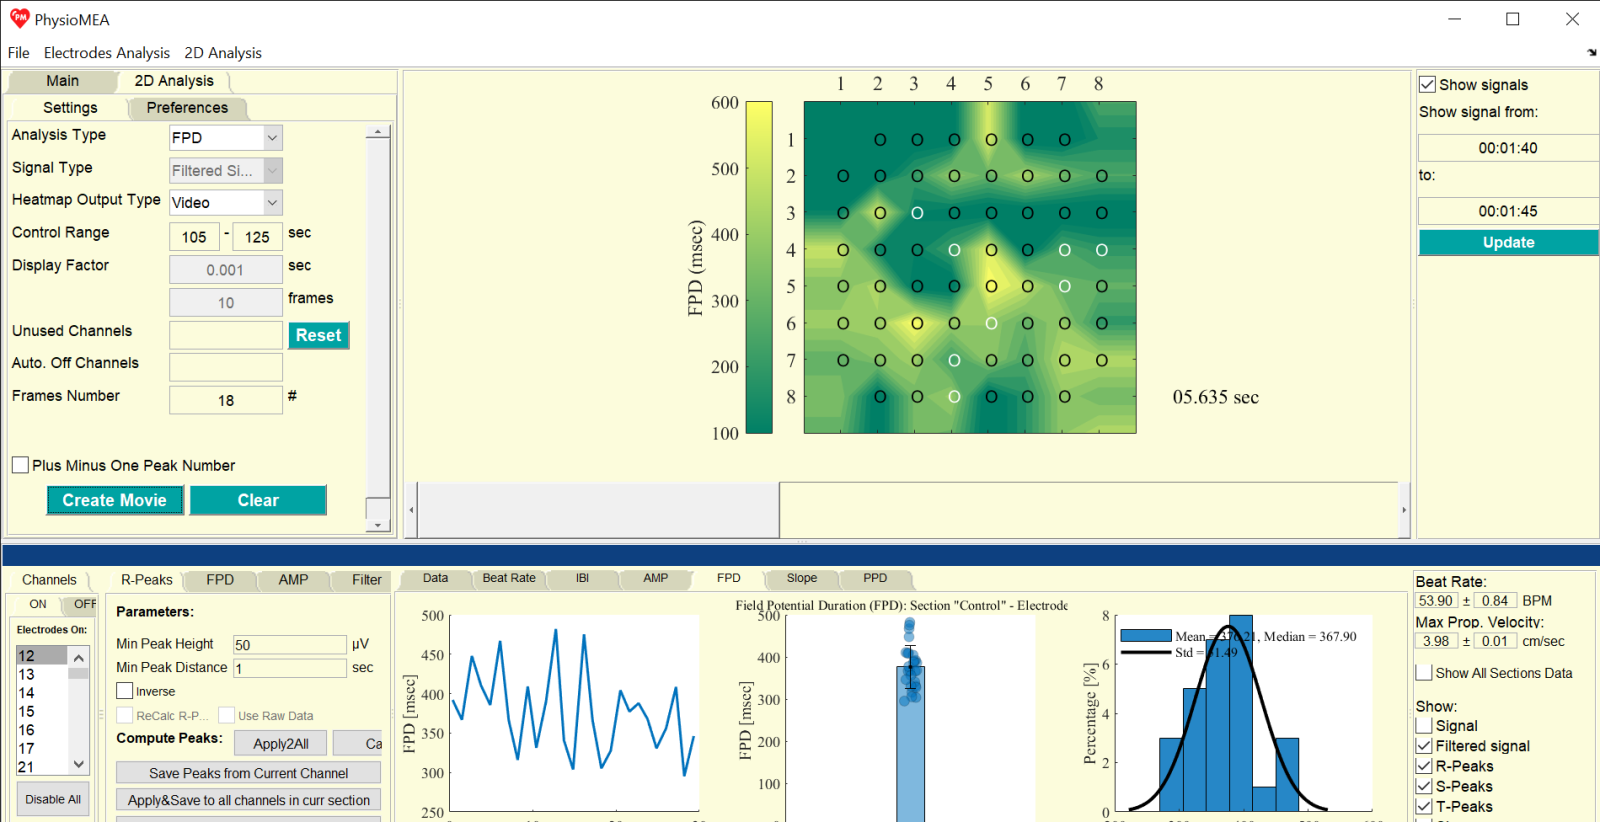
The multi-electrode data can be used to perform 2D biomarker analysis and create 2D heatmaps – a novel analysis method presented for the first time on PhysioMEA Platform. These heatmaps can be displayed as a single map, as a figure with multiple maps presenting changes over time, or even as a video (.mp4 or .avi). Users can choose how to represent the electrodes on the heatmaps (circles, values, directional arrows, or no symbol).
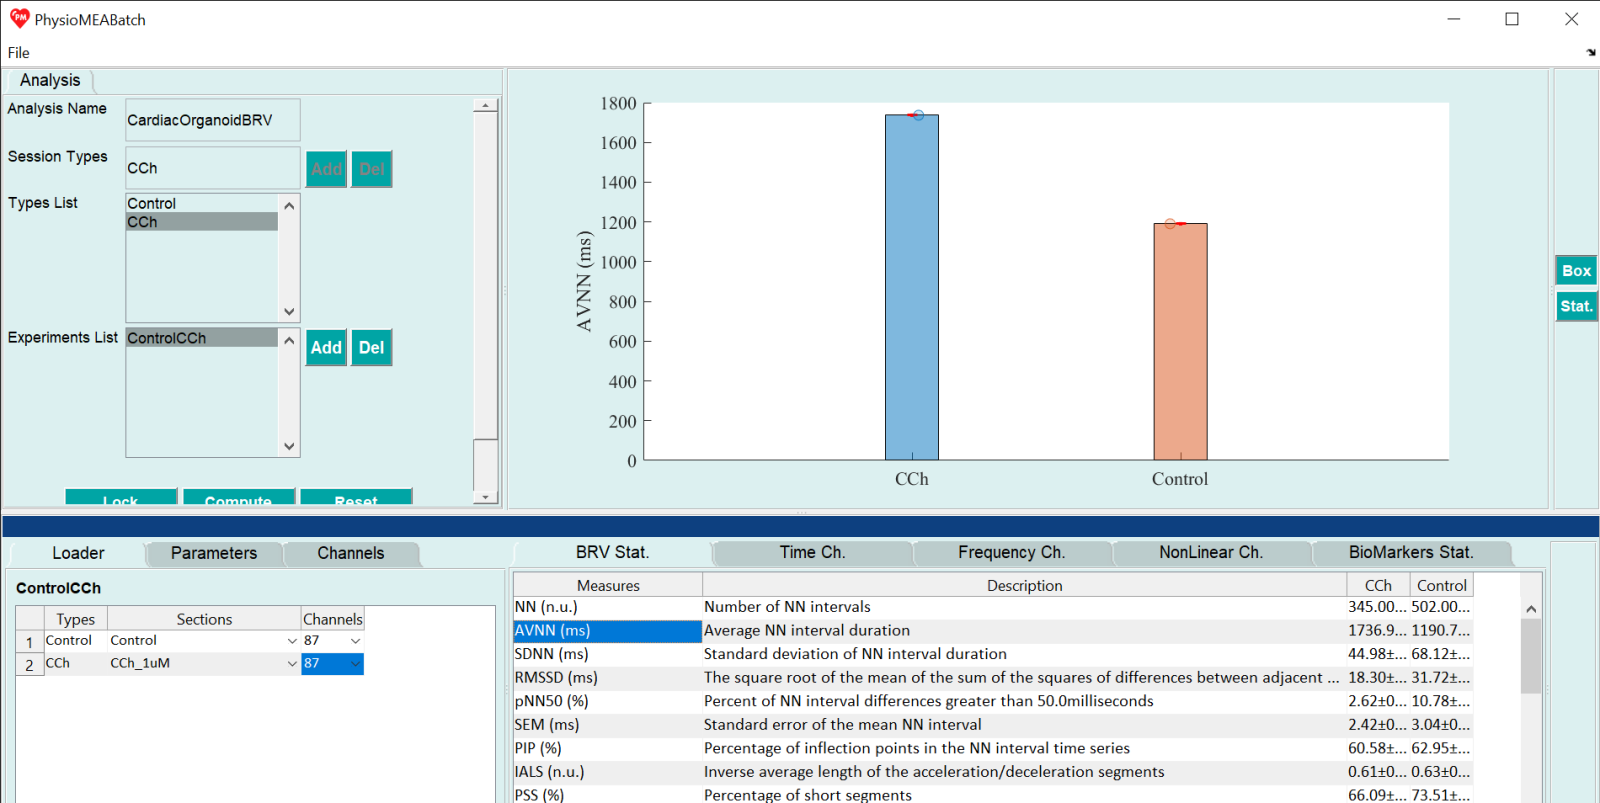
Additionally, with the PhysioMEA Batch Module, users can analyze IBI time-series derived from each data segment for comprehensive BRV analyses that include BRV measure calculations and the generation of BRV graphs for single or multiple segments (e.g., various repeats of the same experiment) and groups (e.g., different experimental conditions or drugs) –full BRV analysis of cardiac constructs (hiPSC-derived cardiac organoids) is a novel analysis presented for the first time on PhysioMEA Platform.